Understanding Synapse through Grafana graphs
It is possible to monitor much of the internal state of Synapse using Prometheus metrics and Grafana. A guide for configuring Synapse to provide metrics is available here and information on setting up Grafana is here. In this setup, Prometheus will periodically scrape the information Synapse provides and store a record of it over time. Grafana is then used as an interface to query and present this information through a series of pretty graphs.
Once you have grafana set up, and assuming you're using our grafana dashboard template, look for the following graphs when debugging a slow/overloaded Synapse:
Message Event Send Time

This, along with the CPU and Memory graphs, is a good way to check the general health of your Synapse instance. It represents how long it takes for a user on your homeserver to send a message.
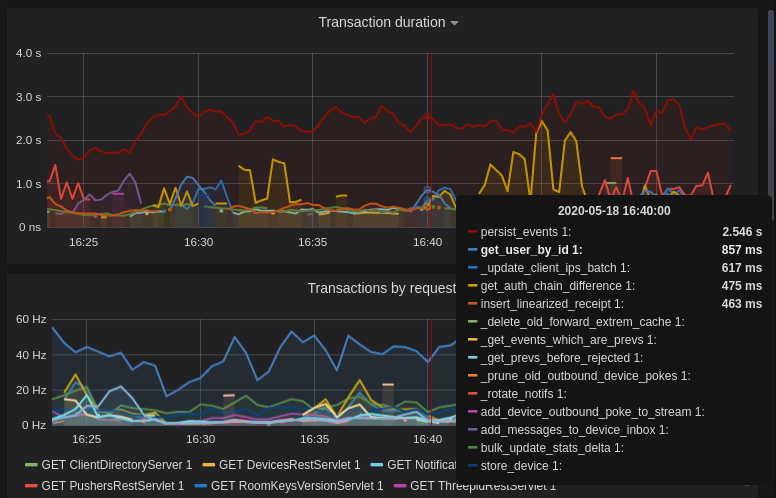
Transaction Count and Transaction Duration


These graphs show the database transactions that are occurring the most frequently, as well as those are that are taking the most amount of time to execute.

In the first graph, we can see obvious spikes corresponding to lots of get_user_by_id transactions. This would be useful information to figure out which part of the Synapse codebase is potentially creating a heavy load on the system. However, be sure to cross-reference this with Transaction Duration, which states that get_users_by_id is actually a very quick database transaction and isn't causing as much load as others, like persist_events:
Still, it's probably worth investigating why we're getting users from the database that often, and whether it's possible to reduce the amount of queries we make by adjusting our cache factor(s).
The persist_events transaction is responsible for saving new room events to the Synapse database, so can often show a high transaction duration.
Federation
The charts in the "Federation" section show information about incoming and outgoing federation requests. Federation data can be divided into two basic types:
- PDU (Persistent Data Unit) - room events: messages, state events (join/leave), etc. These are permanently stored in the database.
- EDU (Ephemeral Data Unit) - other data, which need not be stored permanently, such as read receipts, typing notifications.
The "Outgoing EDUs by type" chart shows the EDUs within outgoing federation requests by type: m.device_list_update, m.direct_to_device, m.presence, m.receipt, m.typing.
If you see a large number of m.presence EDUs and are having trouble with too much CPU load, you can disable presence in the Synapse config. See also #3971.
Caches
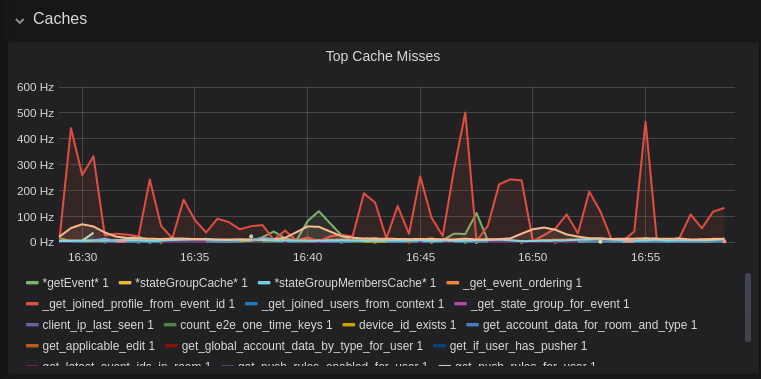
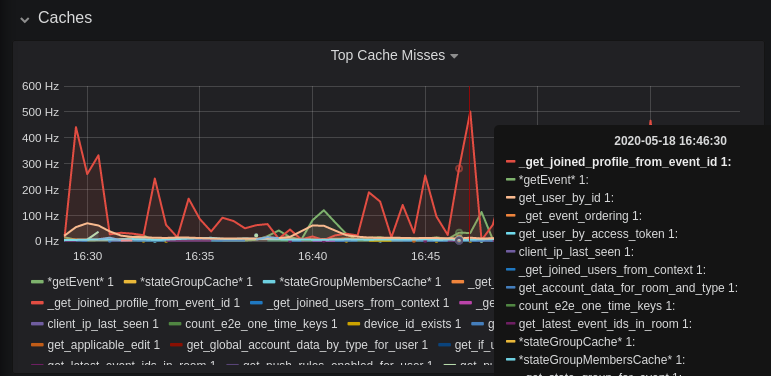
This is quite a useful graph. It shows how many times Synapse attempts to retrieve a piece of data from a cache which the cache did not contain, thus resulting in a call to the database. We can see here that the _get_joined_profile_from_event_id cache is being requested a lot, and often the data we're after is not cached.
Cross-referencing this with the Eviction Rate graph, which shows that entries are being evicted from _get_joined_profile_from_event_id quite often:

we should probably consider raising the size of that cache by raising its cache factor (a multiplier value for the size of an individual cache). Information on doing so is available here (note that the configuration of individual cache factors through the configuration file is available in Synapse v1.14.0+, whereas doing so through environment variables has been supported for a very long time). Note that this will increase Synapse's overall memory usage.
Forward Extremities

Forward extremities are the leaf events at the end of a DAG in a room, aka events that have no children. The more that exist in a room, the more state resolution that Synapse needs to perform (hint: it's an expensive operation). While Synapse has code to prevent too many of these existing at one time in a room, bugs can sometimes make them crop up again.
If a room has >10 forward extremities, it's worth checking which room is the culprit and potentially removing them using the SQL queries mentioned in #1760.
Garbage Collection

Large spikes in garbage collection times (bigger than shown here, I'm talking in the multiple seconds range), can cause lots of problems in Synapse performance. It's more an indicator of problems, and a symptom of other problems though, so check other graphs for what might be causing it.
Final Thoughts
If you're still having performance problems with your Synapse instance and you've tried everything you can, it may just be a lack of system resources. Consider adding more CPU and RAM, and make use of worker mode to make use of multiple CPU cores / multiple machines for your homeserver.